Main Findings and Outcomes
Olin is a small, young college. The full size is approximately 300 and the earliest batch graduated in 2006. This has resulted in relay of course information by word of mouth, due to limited information on courses. We wanted to provide a more unbiased, informed way of providing course information. We also captured behaviors of each major to help students have easier time deciding on majors.
Scenario: Picking a Course
Course registration is coming up and TJ can’t decide which classes to take. There are two courses he’s still choosing between, Immunology and Discrete Math. TJ is majoring in Electrical and Computer Engineering and he will be a junior next Fall. He doesn’t know which courses are best for his major and his grade level. Our project can help by giving TJ statistical insights into the distribution of students in a course and how likely that course is a requirement. No longer will he be lost in indecision.
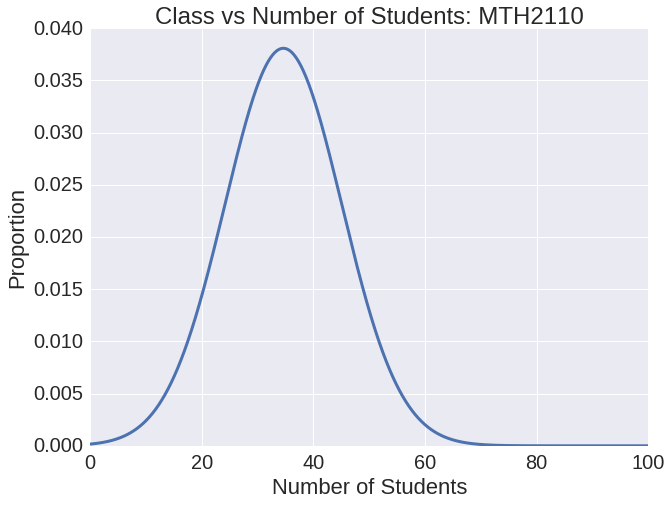
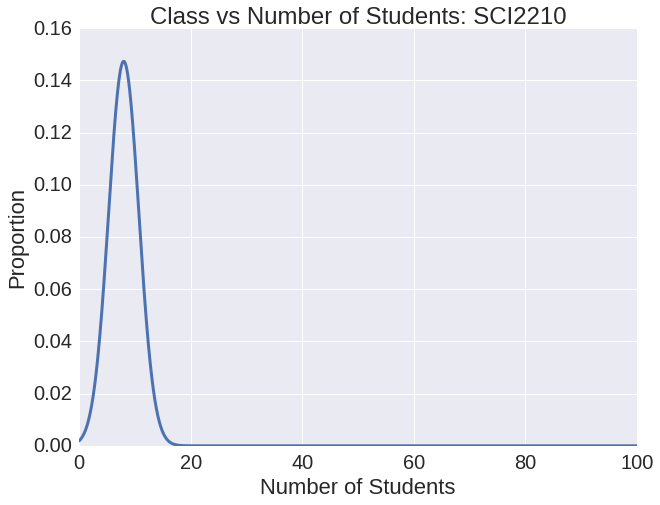
Comparing Average Class Size
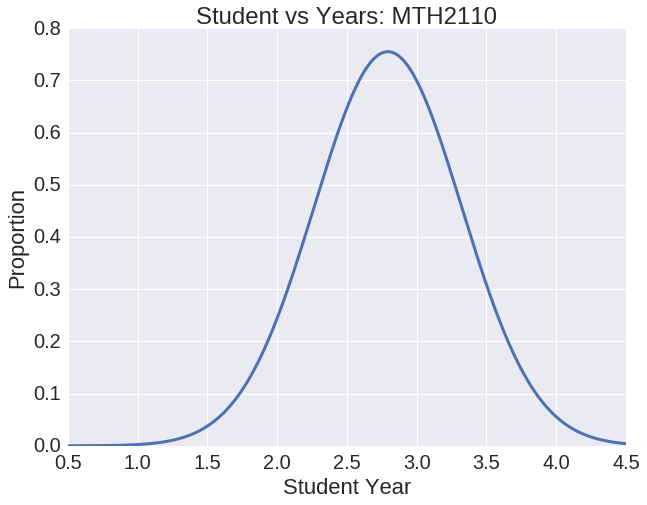
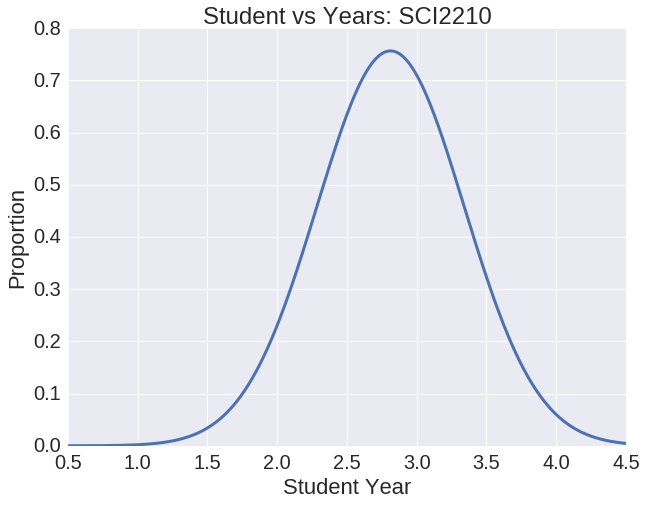
Comparing Average Class Student Year
Observing Class P-Value to Major
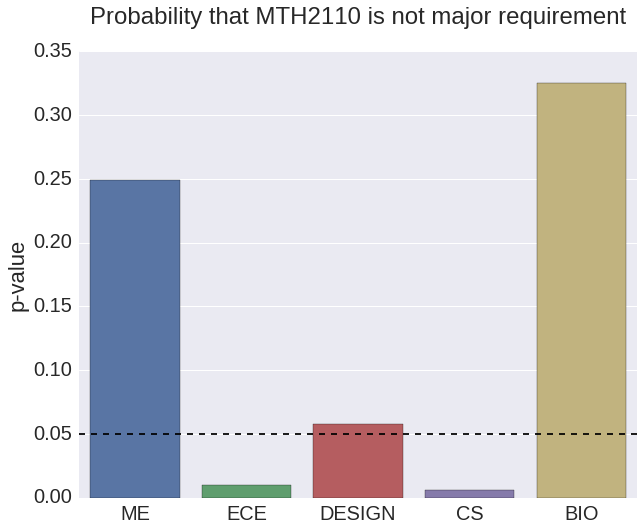
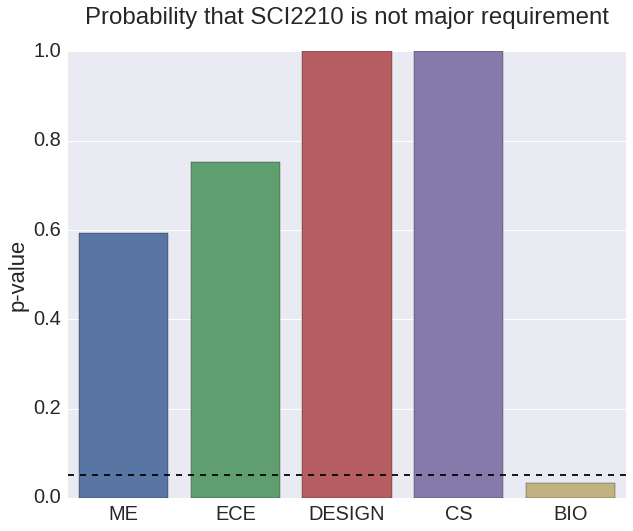
The figures above help TJ to make his decision. He sees that Immunology has a smaller class size, which he likes. On the other hand, Discrete Math is much more important for his major. Both courses are mainly taken by juniors. Now that TJ understands these factors he can make a more educated decision. He chooses to take Discrete Math in order to fulfill his requirements.
Scenario: Major Analysis
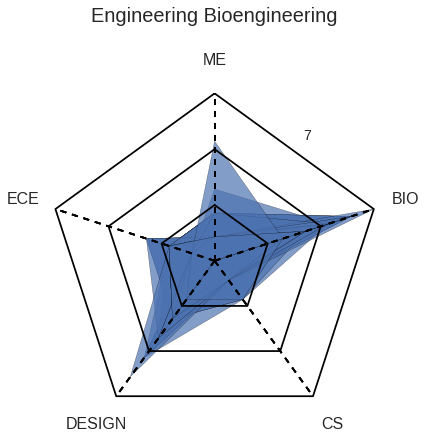
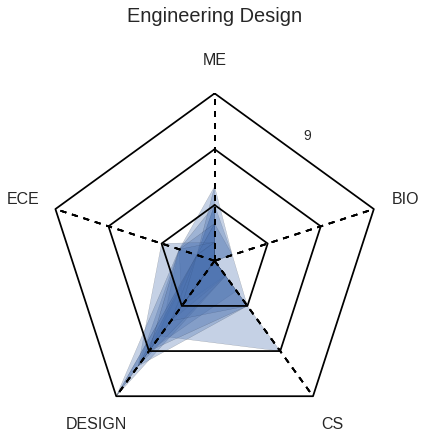
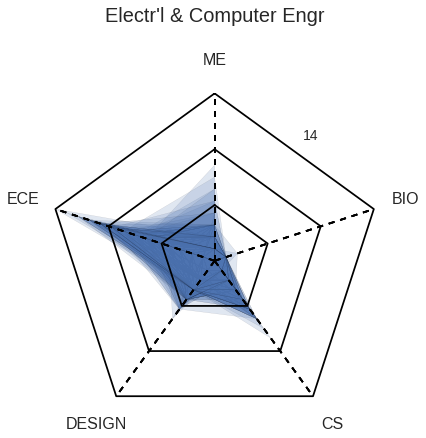
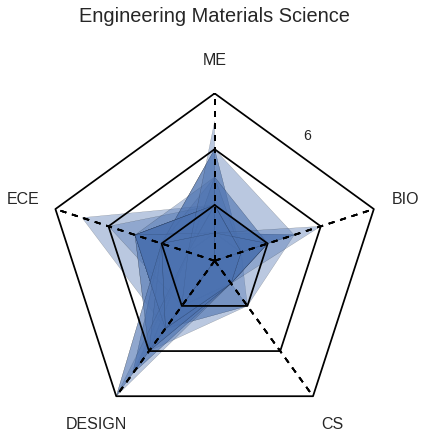
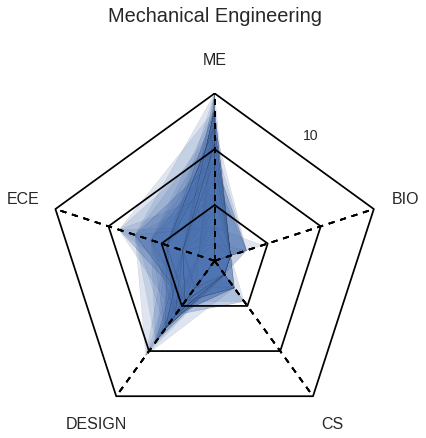
As an ECE major, TJ wants to observe how the courses he took lines up with an average ECE major at Olin by observing the spider diagram that maps each major’s average number of classes taken in each category.
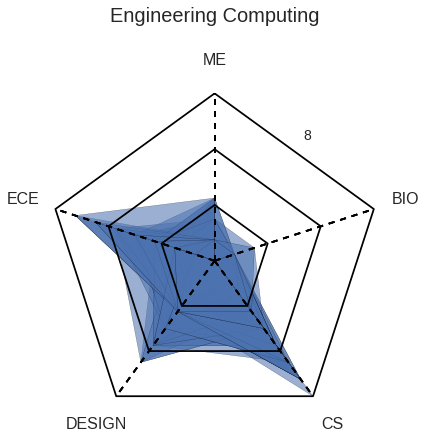
He also takes a look at how many students take either Scope of ADE based upon their major.
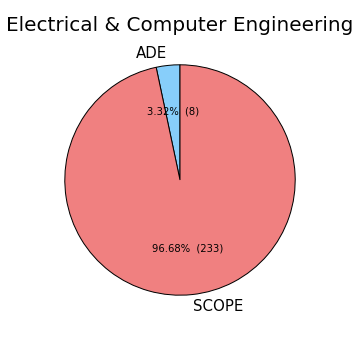
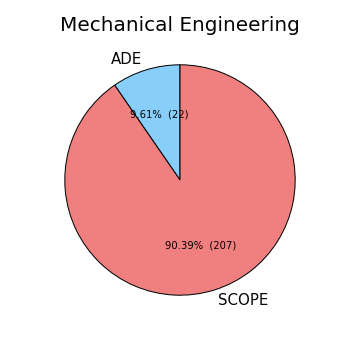
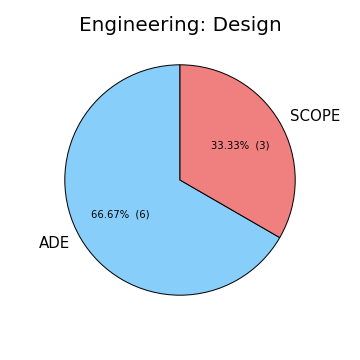
TJ thinks taking Scope may be a good idea, as the majority of the ECEs choose to do so.
Scenario: Machine Learning a Student’s Major
Lastly, TJ will explore using the machine learning feature to take the classes he took and observe which major he will most likely categorized in based upon the registration data. This feature is unavailable to the general user due to privacy issues.
System Architecture
This portion covers the basic techniques we used during our tool development process.
Data Cleaning
During the data cleaning process, we used thorough analysis skills to predict what sort of new dataframe files we could derive from the original one. The original data set included every instance of a student taking a specific course, during a specific semester. Therefore, the data was very redundant and hard to navigate through. Therefore, we used the Pandas library to filter the data each based around a different index.
For example, the student index held information on each student: when they attended Olin, which classes they took, what major they were, and so forth. We generated such csv files for students, professors, majors, and specific courses, in order to streamline our statistical analysis and machine learning process in future steps.
Statistical Techniques
Mean and standard deviation, major components of statistics, were used in this project to describe class size and average student years. Using the newly generated dataframe files, we iterated through each class and the number of students it had throughout the years to get the mean and standard deviation on each class. We also looped through each instance of a student taking a specific course to pull together information on the course of interest and the year of the student together to obtain the mean and standard deviation of the year the student took the course.
We also implemented the P-value of statistics to observe from the sample of students, how the taking of specific courses relate to the major they select. The P-value represents the odds of a certain event happening given the “null hypothesis” as true. For example, in order to see if the course Signals and Systems was taken more often by students who had a specific major beyond the possibility of chance, we would claim the null hypothesis as saying every major has an equal chance of taking Signals and Systems. After analysing the sample of students and their classes, we can see that Signals and Systems have a P-value lower than 0.05 for ECE students. We often use 0.05 as a cutoff for observing whether the effect occurred by chance or not.
Machine Learnng Techniques
Clustering was used to find possible trends that the computer learn based on enrollment data. The enrollment data shows the classes students have taken in Olin. The axes of the cluster graph are arbitrary and are a summary of the many different variables the relationship between the student and courses summarized into two axes.
Logistic regression was used to predict the major based on the courses the students have taken. The enrollment data was divided up into freshman, sophomore, junior and seniors enrollment data. These datasets were used to train separate models for different grades. Random forest classifier and logistic regression algorithms were used for predicting all the major at once since all the values are either true or false. However, this resulted in a very low accuracy for freshman and sophomores. Therefore, we moved on to predicting for each major separately and this boosted up our accuracy. We’ve trained the models for every major and grade and pickled them for further use - possibly on a website.
It is important to realize that the machine learning techniques are not accessible to the user due to different issues. The machine learning was more of a stretch goal where we explored beyond the scope of the project to try and blend statistics and machine learning together. Moreover, in order to present the machine learning experience the user to interact with, although the data used was trained algorithm, there is potential for privacy issues when offering the machine learning functions to the users.