Obtaining Data and Cleaning it
What we want to do:
For the final project of Data Science 2016, we want to take course registration of previous years at Franklin W. Olin College of Engineering and develop a tool based upon statistical analysis of the data set. This tool will help students determine how their peers in the past have structured their college academic program, and will help guide them when they are unsure which path to take. Below we note important happenings of the first phase of this project, and the lessons we have learned.
Data Collection and Privacy
A big roadblock our team has run into during the first two weeks was privacy. In order to get the newer course registration data, we had to sign a consent form and had to wait a few days. During that time, we were observing for depth and trends within the old data set. However, when we did receive the new data set, we had to dispose of the old one. The newer data set had less information than the older one, specific information on student graduation class, and gender information were no longer given. We were disappointed that a lot of potential analysis of trends were lost. But at the same time we understand that with the graduation class and gender information, students can easily be tracked down, and such information needs to be sacrificed for privacy. From this experience, we learned that every project had some sort of trade off between ambitions and respect to privacy. It is important to respect those who gave their information to the data set, and it is crucial that we work around it and not let this hamper our progress.
Data Exploration
Our initial exploration was done with the old student registration data set. Initially, we set out to create a wide range of visualizations in order to get a grasp on how the dataset was formatted.

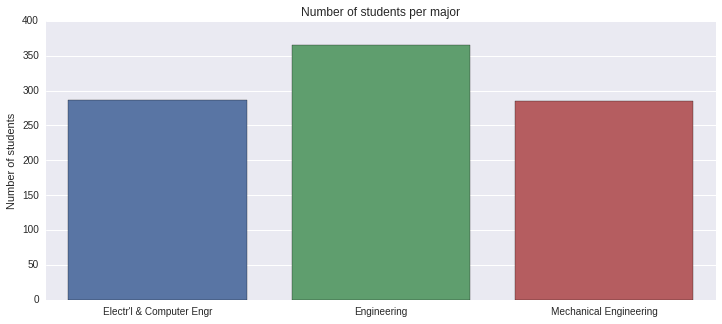
The first visual representation plots all the different students’ count of major throughout the years. This data gave us insight into how different majors may have more people, thus the registration being more competitive.

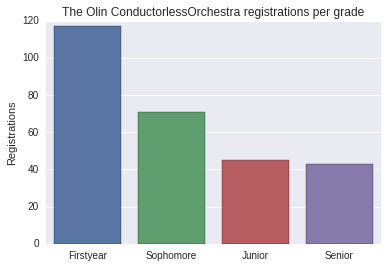
The second visual representation shows how many people per grade on average take the OCO. The plot shows that the first years mostly take the Olin Conductorless Orchestra. Maybe this is because they want to try it out, or initially attempt to continue playing their instrument. The contribution can also come from how they have pass/no credit semester and has more freedom to try out new things without affecting their academics.

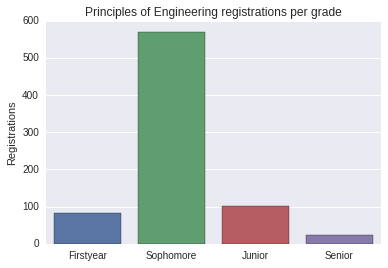
In contrast to the Olin Conductorless Orchestra, much more sophomores take Principles of Engineering in their second year compared to any other grade. A representation like this may show us, or the potential user in the future, that many students opt to take this course because many other people take it at the same time. Maybe taking it earlier or later will allow the student to take a different course they want to, knowing they may have priority in registration as their grade goes up.
Data Cleaning With the visualization and exploration, we got a sense of how our data set was shaped and how we wanted to use it. We wanted to allow the student to explore the data and have an understanding of what others did in order to make logical decisions on their own classes. In the process of using the tool, a student may opt to prioritize things differently, for example by major, professor, class popularity, and so forth. In order to streamline the use of specified preferences, we generated multiple csv files based upon the original one we had. Each csv file held a different focus, such as professors, courses, and students. Each focus had different descriptions. As an example, we will walk through the generation of the course-semesters csv file. This file provides information about a course offered during a given semester.
from collections import OrderedDict
course_semesters = OrderedDict()

columns =  ['code-semester',
        	'code',
        	'semester',
        	'name',
        	'prof',
        	'redundant_codes',
        	'prereqs',
        	'student_ids']

for column in columns:
	course_semesters[column] = []

grouped = data.groupby('code-semester')
for group in grouped:
	code_semester = group[0]
	registrations = group[1]

	first_registration = registrations.iloc[0]
	code = first_registration.code
	semester = first_registration.semester
	name = first_registration.course_fullname
	prof = first_registration.professor
	redundant_codes = [] # TODO: figure out what the redundant codes are
	prereqs = [] # TODO: figure out what the prereqs
	student_ids = registrations.id.unique().tolist()

	course_semesters['code-semester'].append(code_semester)
	course_semesters['code'].append(code)
	course_semesters['semester'].append(semester)
	course_semesters['name'].append(name)
	course_semesters['prof'].append(prof)
	course_semesters['redundant_codes'].append(redundant_codes)
	course_semesters['prereqs'].append(prereqs)
	course_semesters['student_ids'].append(student_ids)

course_semesters_df = pd.DataFrame(course_semesters)
In the code snippet above we take the original data, where each row corresponds to a single course registration, and create a new file where each row corresponds to a course offered during a given semester. We start by defining the columns that our table will have. In this example, some of those columns are the course code, professor’s name, and students enrolled. We then create a dictionary that will allow us to easily fill in all of the data. Once we have collected all of the information and added it to the dictionary, we create a data frame from that dictionary.
When the student uses the course finding tool, how the student prioritizes their search will use different csv files, streamlining the process.
Future Steps to Take
From here, we want to move into the statistical realm where all of our visual representations are not simple histograms, but have a foundation in statistics. Interesting statistical methods may include p-tests and observing standard deviation. Also, we want to start developing an interface for the tool, and algorithms.